|
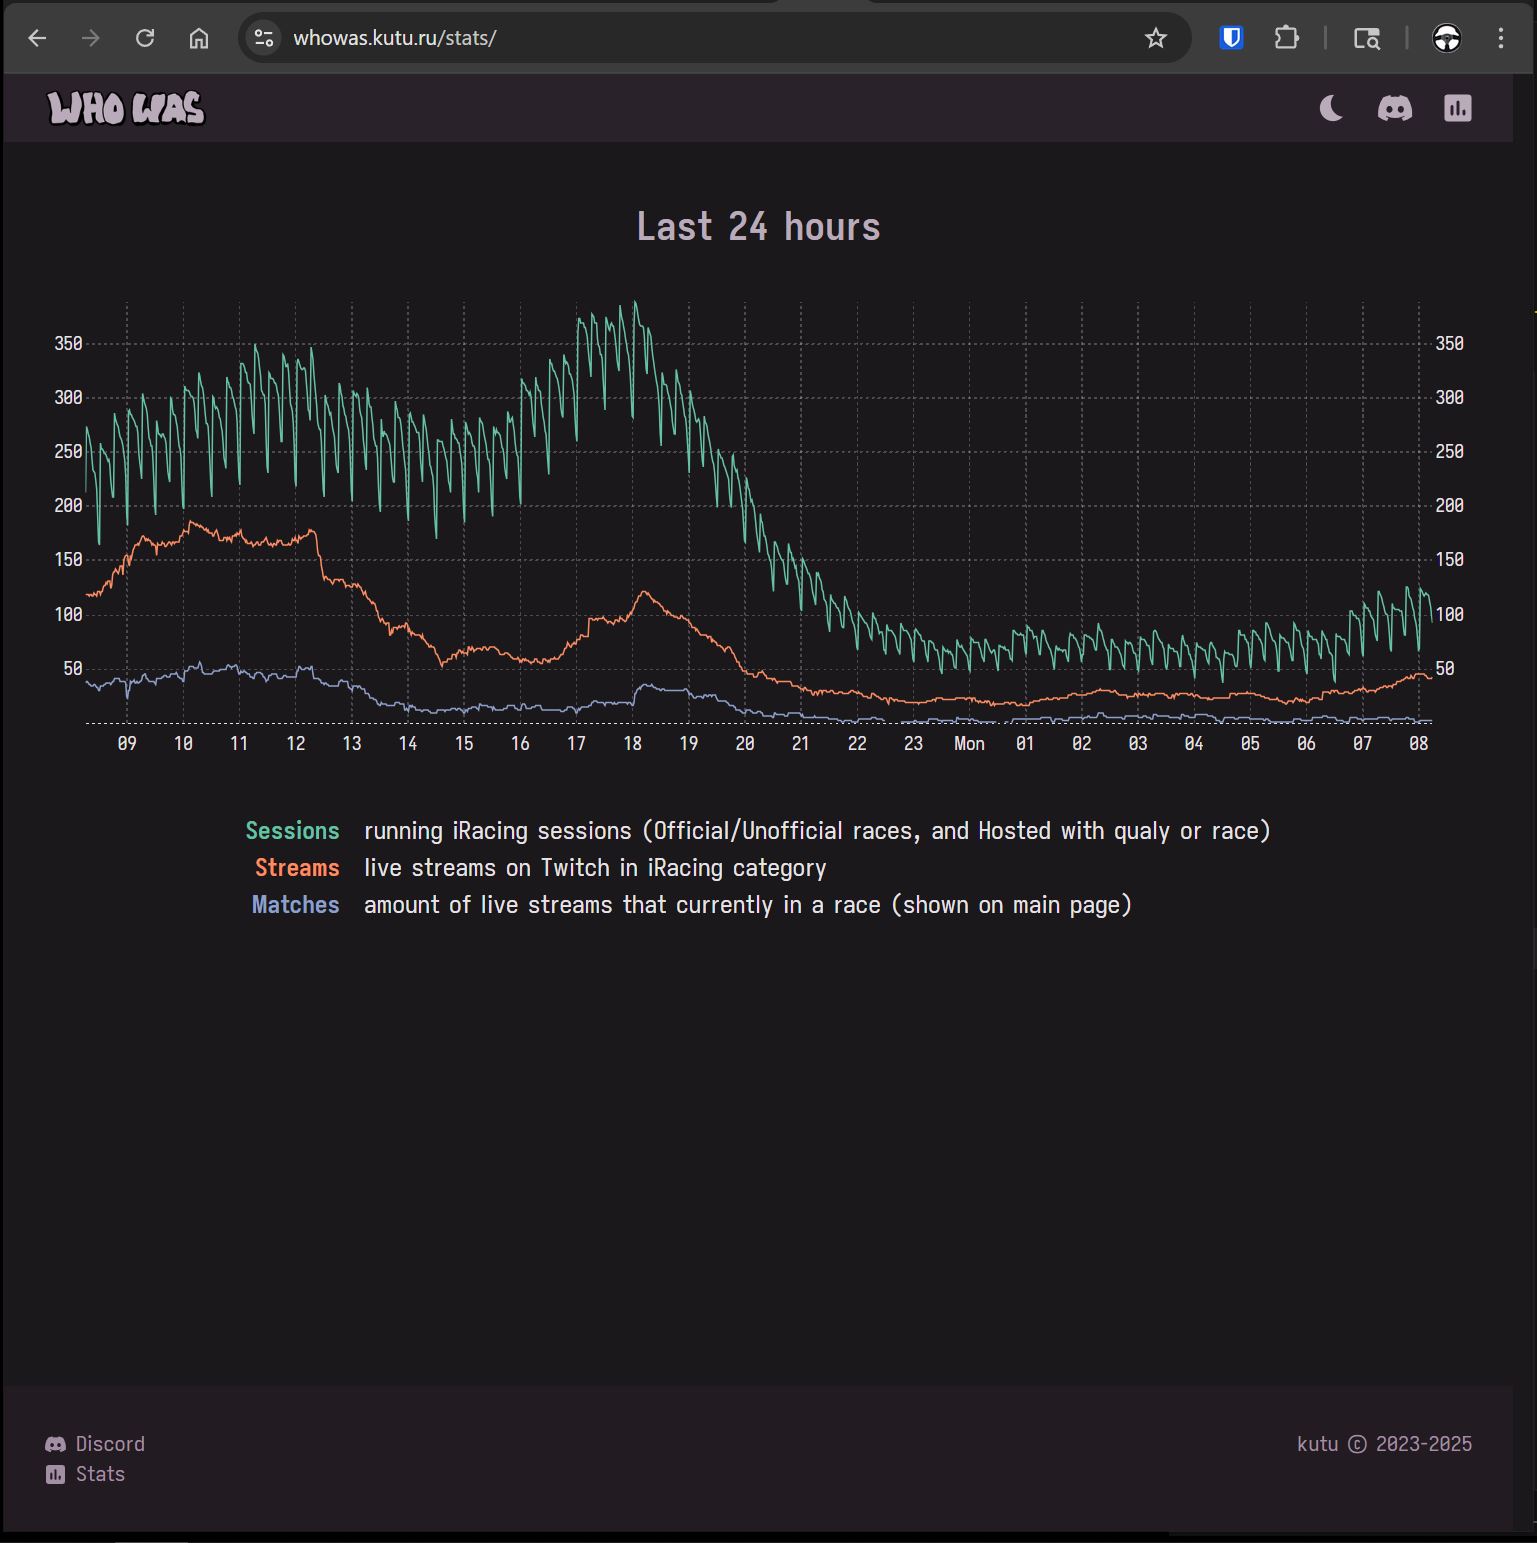
Kutu had a neat Stats page on WhoWas that showed the iRacing sessions,Twitch iRacing streams and Matches on WhoWas values over time. I wanted to borrow from that for our site. The graphs he presented were simple, but effective at showing how many people were racing, how many were streaming and how many were shown on his site. When there special events or big endurance races on the weekends, it was neat to see the Twitch/WhoWas activity spike. The daily ebb and flow was also kind of interesting and showed off how international/global the participation really is. |
 |
|
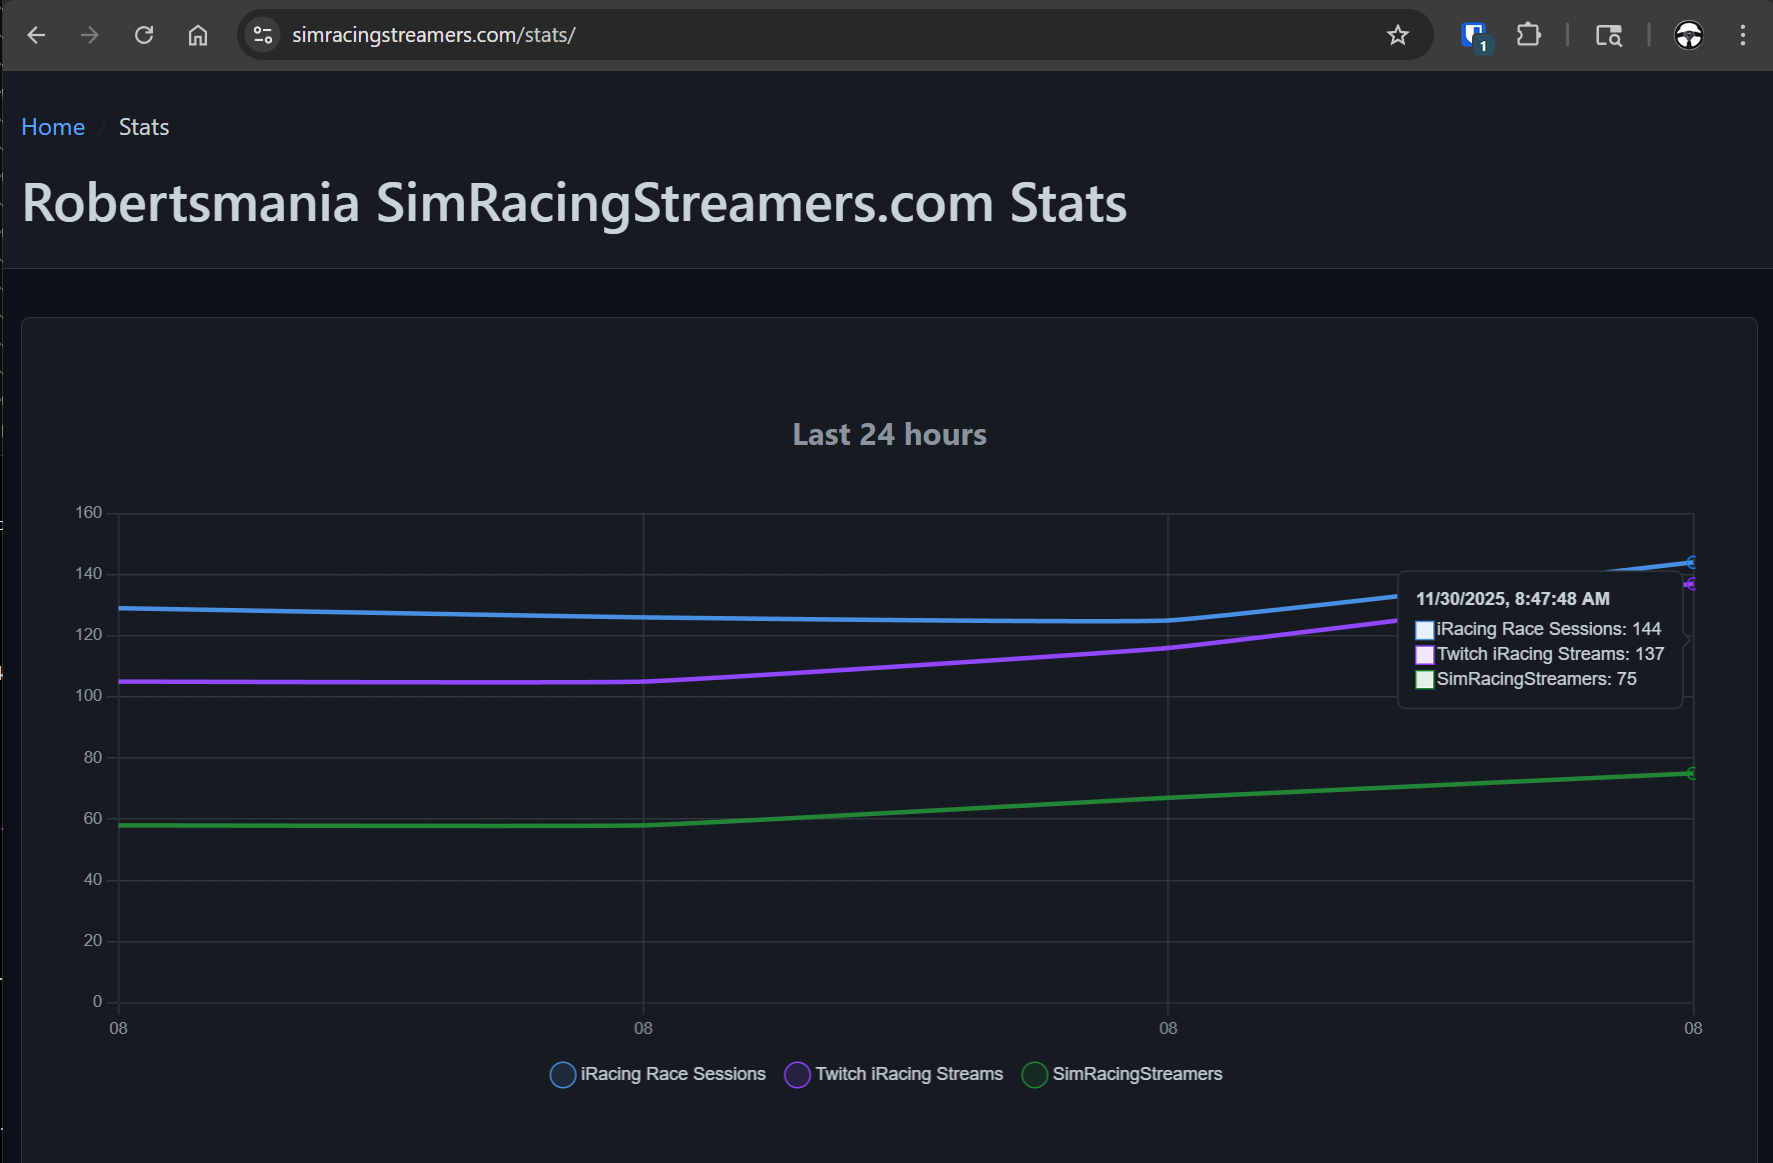
So we added some data metrics collection to the Python scripts that run the backend processing to collect those same values. At first it was a little underwhelming, and I wasnt really sure how it was going to look or if it would be as helpful as what Kutu had, particularly because at that time our system was only collecting data every 15 minutes. It did look like it was working so I figured it couldn't hurt and might actually turn out to be valuable. |
 |
|
Sure enough, after running for 24 hours or so it looked a lot more familiar and even with the relatively infrequent data collection frequency, I knew it would be a good thing to have. Obviously getting the green line (our matched broadcasters on SimRacingStreamers) to approach or match the purple line (iRacing Twitch streamers) is a goal. An unrealistic goal that we never really reach, there are always new streamers... But its good to have goals. | 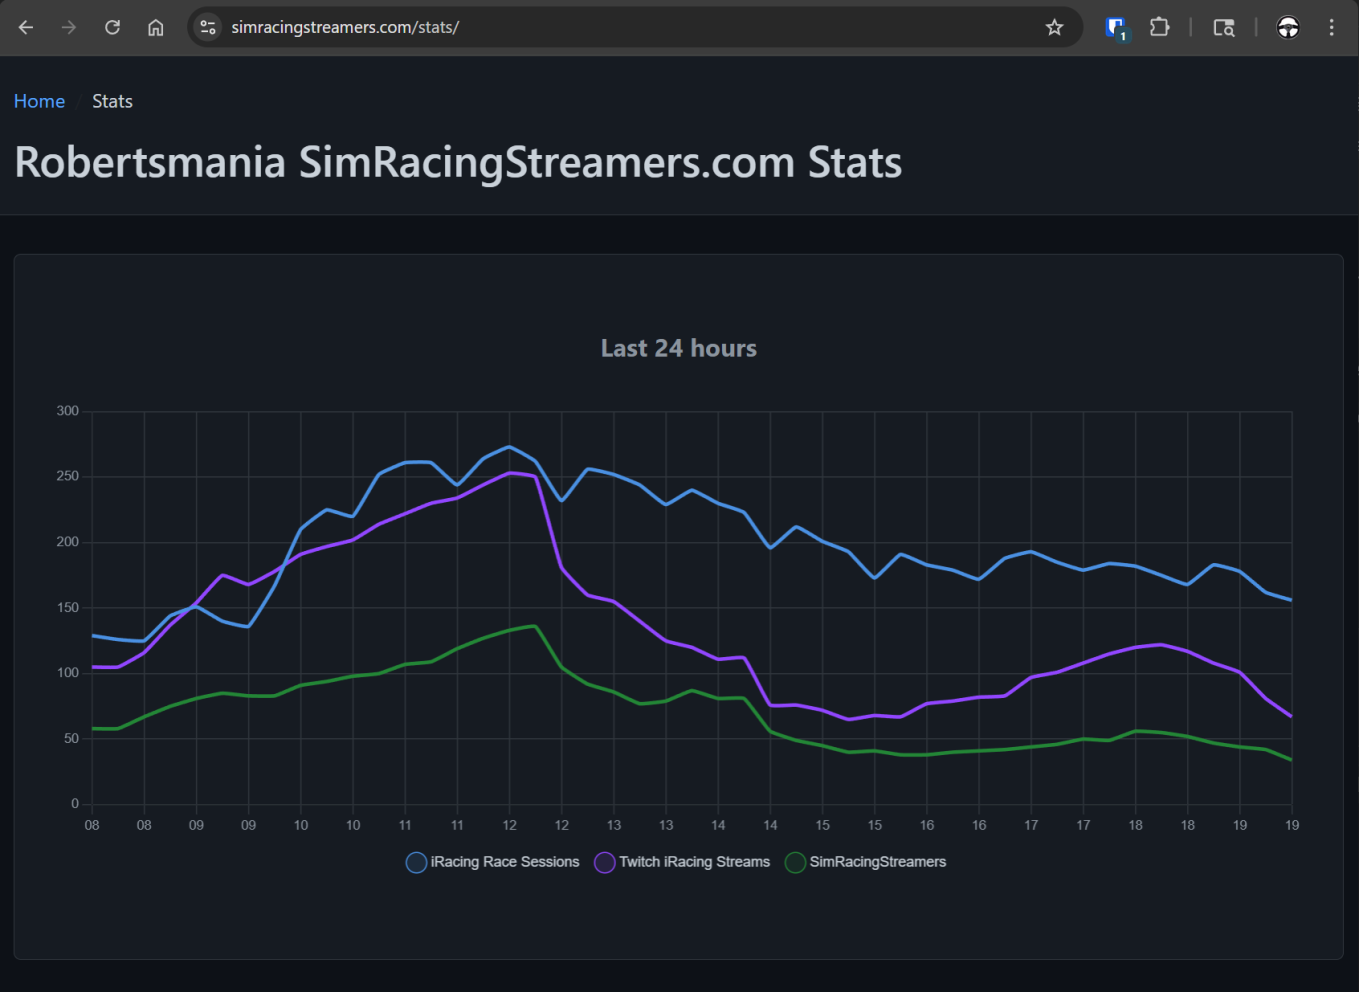 |
|
Apparently it’s time for the Global Endurance Tour! 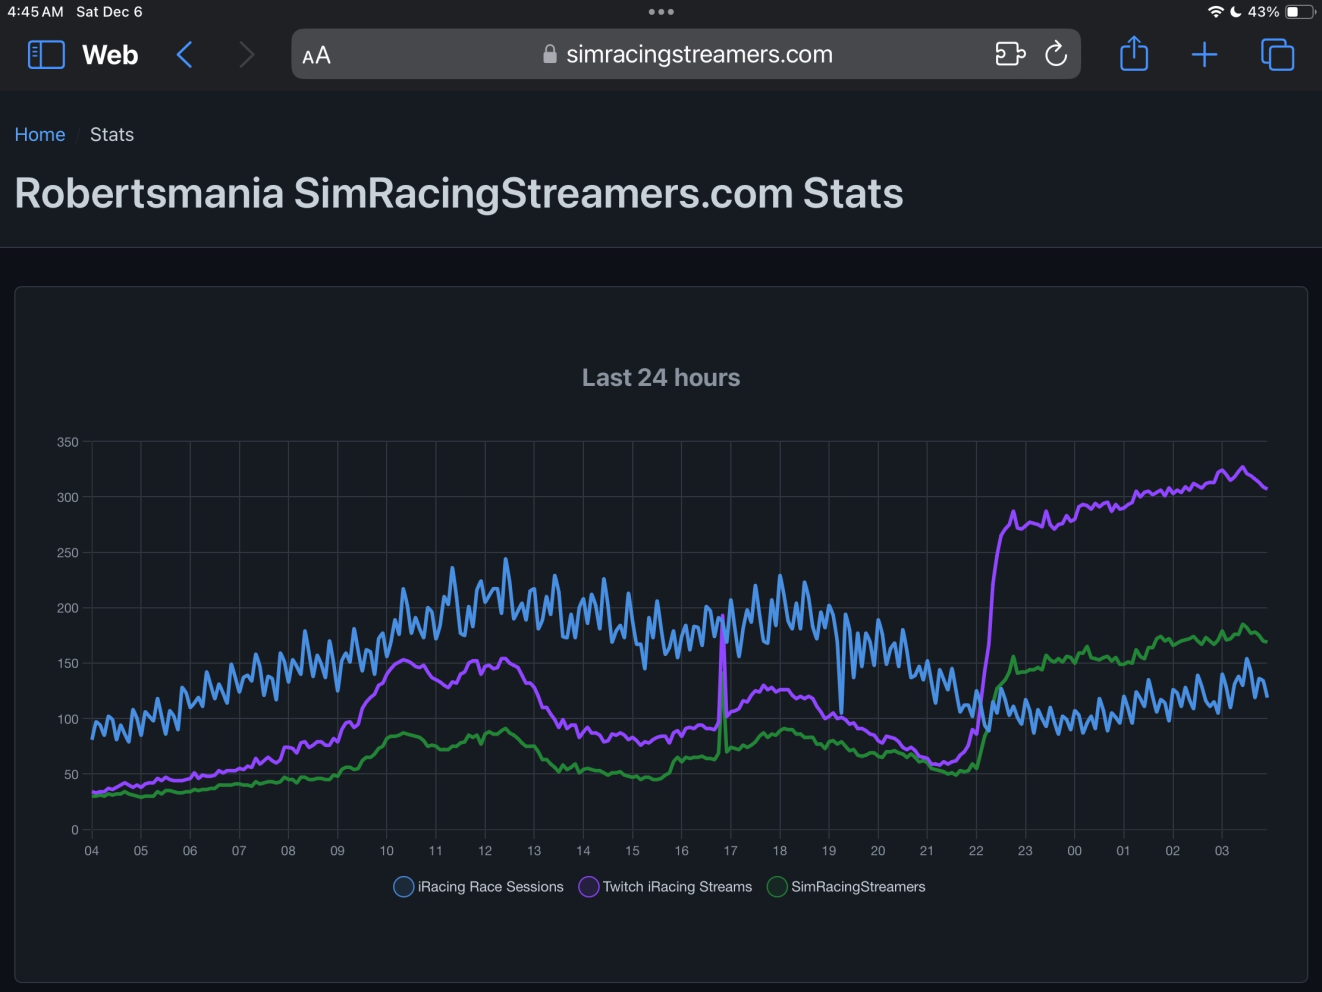
|
And it looks like that's it for the Daytona 24! 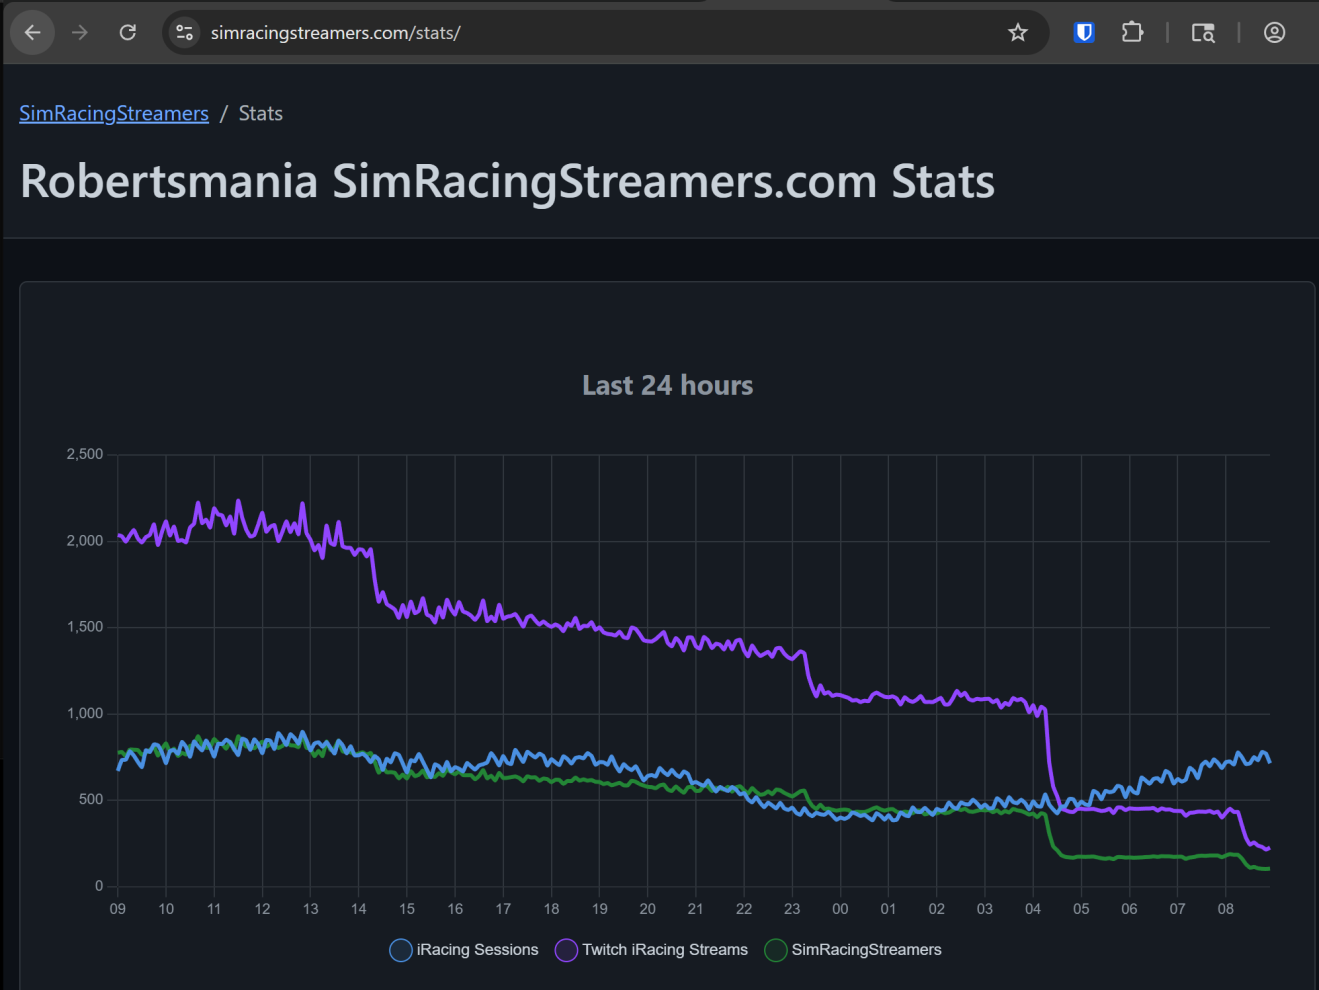
|
|
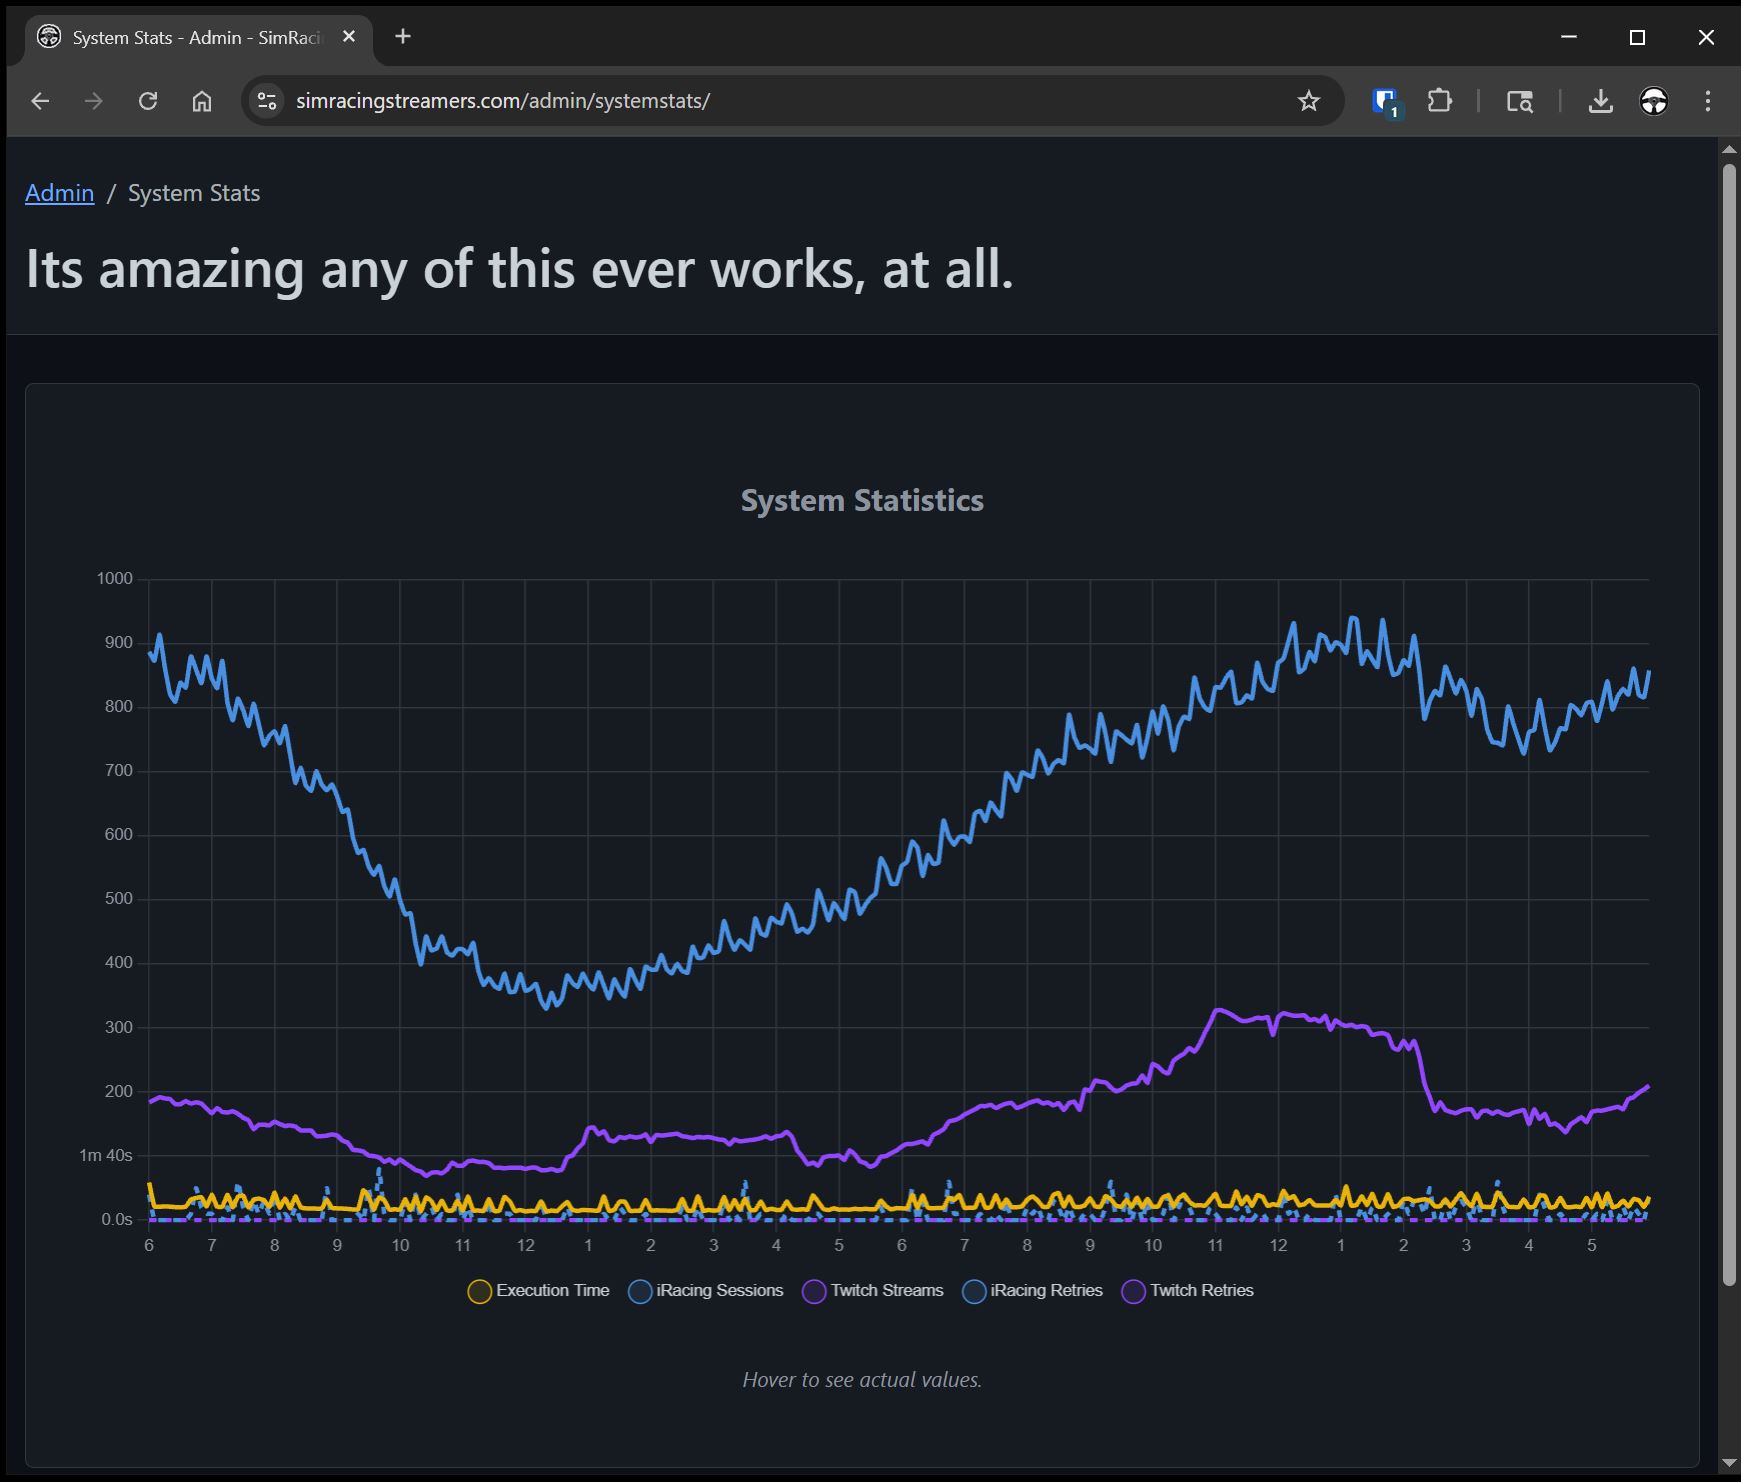
In addition to keeping an eye on the public data for the site we have another SystmStats in the admin section. The admin graph includes values for the time it takes the backend data collection, the number of iRacing API timeouts, any Twitch API timeouts, etc. The data over the course of a day is really helpful in tuning and optimizing things like the number of worker threads to download the iRacing session data. Watching individual runs or even just an hour or two doesnt show the whole picture for how things behave over the long term. But the 24 hour data in the admin SystemStats really helps! |
 |